Mechanical Testing of Biomaterials: A Reproducible Protocol Guide
Contents / 目录
Why Reproducible Mechanical Testing Is Hard
Mechanical testing looks deceptively simple. Clamp a specimen, pull it, record force and displacement, and convert the result into a modulus. In practice, nearly every step can quietly change the number that ends up in a figure, and most of those changes are never visible in the published plot. A dry hydrogel tested with a fast crosshead speed, a tendon gripped in knurled serrated clamps, or a nanofiber mat whose cross-sectional area was estimated from bulk geometry can each look perfectly scientific while being wrong by a factor of two or more.
Biomaterials make this problem worse because they are wet, soft, anisotropic, rate-dependent, and frequently irregular in shape. The same protocol that works for a steel coupon will not work for a collagen gel, and a protocol that works for a single silk fiber will not transfer to a centimeter-scale porous scaffold without rethinking the assumptions. This article is a practical guide to the decisions that matter most. It is written for researchers who want their measurements to be defensible rather than merely publishable.
A useful way to think about this problem is to imagine being asked to weigh an object, but being allowed to touch it, change how much of it rests on the platform, and then choose for yourself which reading to record. If the same five people weigh the same object under those loose rules, they will produce five different numbers, and all five will be able to defend their procedure. Mechanical testing of soft and wet materials often looks exactly like that loose rule set, except that the choices are hidden inside a protocol paragraph and rarely re-examined.
The reason artist-level care has to be trained rather than assumed is that every measurement is a chain. The specimen must be prepared and equilibrated, mounted without damaging it, held so that load and displacement are recorded where the deformation actually happens, and finally reduced into an area-normalized stress and a reference-length-normalized strain. Each link in that chain contributes both a random scatter and a systematic offset, and the offsets do not cancel. A gauge length recorded as 25 mm when the true initial length was 20 mm creates a strain that is 25% too small before the machine has even started; a diameter that is 10% too large inflates the cross-sectional area by about 21% and therefore deflates the modulus by nearly the same amount; half a millimeter of unnoticed grip slip masquerades as extra elongation. None of these errors changes the shape of the plot enough to look alarming, which is exactly why they survive into print.
The distinction worth keeping in mind throughout this guide is between random error and systematic error. Random error can be reduced by repeating the measurement and is reported by a standard deviation or confidence interval. Systematic error cannot be reduced by repetition; every sample will be wrong by the same direction and roughly the same amount until the protocol is changed. The disciplines described below are mostly aimed at the second, more dangerous kind of error, because it is the one that survives averaging and quietly moves a modulus or a failure strain between laboratories.
Specimen Geometry and the Hydration Problem
The first decision is the specimen itself. For fibers, films, and sheets, the standard dog-bone geometry reduces the chance that failure initiates at the grips by forcing fracture into the gauge section. For soft gels and tissues, a rectangle with a length-to-width ratio of at least 4:1 is a reasonable compromise, but the aspect ratio must be measured after clamping rather than assumed from the mold. For compression, parallelism of the top and bottom faces is at least as important as their nominal dimensions, because a tilted platen converts an apparently uniform deformation field into contact stress concentrations.
The hydration state is not a minor environmental variable; it is part of the material definition. Silk fibroin, collagen, cellulose, and most hydrogels exchange water continuously with the surroundings, and their stiffness, strength, and fracture energy all track water content. A specimen that is mounted in air will generally dry at its exposed surface, become stiffer near the surface, and fail prematurely or inflate the apparent modulus. The standard fix is to immerse the specimen in a temperature-controlled bath of the same buffer, saline, or culture medium used during preparation, and to allow sufficient equilibration time before starting the test. If immersion is not possible, the chamber humidity and exposure time should be reported as first-class experimental variables. A loaded specimen that visibly changes geometry over the equilibration period is telling you that it was not equilibrated.
Sample sizing belongs in the protocol for the same reason a control belongs in an experiment: the number of specimens decides whether the measured scatter is evidence about the material or evidence about your handling. A soft hydrated tissue can easily show a coefficient of variation of 15 or 20 percent even with careful technique, because every specimen carries a slightly different history of extraction, hydration, and residual strain. If only three specimens are tested, the confidence interval for a mean modulus can be so wide that a 30 percent difference between two groups is statistically indistinguishable from zero. A practical starting rule is to treat the first six to ten specimens as a pilot study, compute the standard deviation, and then decide whether the comparison you plan to make actually has the power to see the effect you are looking for. This sounds like statistics, and it is, but it is statistics that directly protects the mechanical numbers you will publish.
Cutting and shaping methods are equally easy to understate. A blade that drags through a soft gel can introduce surface tears that become macroscopic cracks under tension; a laser cut can leave a heat-affected rim whose crosslinking or crystallinity differs from the interior; a punch can crush the network at the edge. Whichever method is used, the prepared edge should be inspected under low magnification before testing, and the protocol should record the cutting method next to the geometry. Where the goal is comparability, prepare calibration specimens and test specimens with exactly the same cutting direction, because many biomaterials retain a preferred orientation that survives shaping and reappears as anisotropy in the measurement.
Preconditioning is the third frequently under-specified step. Biological materials often show a dramatic first-load response that never returns: fibers straighten, water redistributes, weakly bonded junctions relax, and local damage is erased or created. A single stress-strain curve taken on the first pull is therefore a mixture of material history and material property. Repeating a gentle load-unload cycle until the loop stabilizes, and reporting the cycle number and amplitude, separates the two. The residual strain observed after the first cycles is itself informative: a small equilibrium residual suggests reversible rearrangement, while a growing residual strain across cycles is an early warning of accumulated damage or dehydration, and should be recorded rather than silently discarded.
Instrumentation, Alignment, and Boundary Conditions
The load cell and the stroke sensor are the two most important contributors to systematic error. A high-capacity machine measuring a soft millimeter-scale specimen may be operating near the bottom of its range, where the manufacturer's calibration is often the least reliable. It is usually better to choose a lower-capacity load cell, verify the zero value after the pretest warm-up, and perform a reference calibration with a known mass in the actual loading direction. Displacement measured from the crosshead includes machine compliance, grip slip, and specimen end-effects, so non-contact extensometry, video tracking, or optical strain measurement should be used whenever modulus is the quantity of interest.
Grip choice is part of the measurement, not just hardware. Oversized ridges, aggressive serrations, and excessive clamping force create stress concentrations and premature failure, especially in brittle ceramics-like composites and thin biological films. Soft pneumatic grips, adhesive tabs, or compliant backing layers distribute load more uniformly and are usually preferable for soft biomaterials. The boundary condition also includes the loading rate. Biological materials are viscoelastic and viscoplastic, so a "quasistatic" test at 1 mm/min and a test at 100 mm/min can agree only if the protocol defines both the strain rate and the specimen history, including preconditioning cycles. For comparative reporting, precondition a specimen with several gentle load-unload cycles and state the number of cycles, the amplitude, and the rate, because the first cycle of most biological samples erases handling and assembly history.
Choosing the right instrumentation usually comes down to matching three things: the force range, the displacement resolution, and the compliance of the fixtures relative to the specimen. A universal testing machine with a 10 kN load cell can measure a silk fiber, but it will do so near the bottom of its range, where the reading is dominated by noise and by the machine stiffness that must later be corrected away. A 10 N or even 1 N cell sacrifices nothing for a soft specimen and moves the measurement into the region where the calibration has meaning. The displacement channel deserves the same scrutiny: if the actuator reports 0.1 millimeter accuracy and the specimen extends only 1 millimeter before failure, then ten percent of the strain is instrument error. Non-contact optical tracking removes most of this, but it must be validated on a ruler or calibration grid in the same focal plane as the specimen, because a camera angle error is converted directly into a strain error.
Compliance correction is the difference between trusting the machine and trusting the specimen. When load is applied, the frame, load cell, grips, and adapters all deform by a small amount that is not part of the sample. For a stiff mineralized composite this compliance is usually negligible, but for a soft hydrogel or a single fiber it can equal or exceed the specimen deformation. The standard correction is to measure the machine compliance with a rigid dummy specimen, record its force-displacement response, and subtract that displacement from every subsequent test at the same loading configuration. This correction is configuration-specific; changing the grips, the gauge length, or the loading rate usually changes it, which is another reason protocols that omit fixture details cannot be reproduced.
Grip strategy and environment go together because the worst boundary condition is a clamp that tears the specimen while an ambient air current is simultaneously drying it. For films and thin sheets, adhesive-tabbed specimens spread load over a broad area and keep failure away from the clamp face. For fibers, a small drop of compliant adhesive on a rigid template performs the same function without the stress concentration of serrated jaws. For gels and tissues, saline-filled or temperature-controlled chambers are essential not because they are more realistic but because they make the material state stationary during the test. If an environmental chamber is unavailable, the fallback is to perform the mechanical test inside a humidity-controlled enclosure and to weight the specimen immediately before and after, so that later reviewers can see whether the material changed state during the measurement.
From Force-Displacement to Stress-Strain
Stress is force divided by the cross-sectional area over which it acts, and strain is the change in length divided by an initial reference length. Both definitions hide choices. For engineering stress and strain, the reference geometry is the initial geometry; for true stress and strain, it is the instantaneous current geometry. The two are similar in the small-strain regime and diverge substantially at large extensions, which is precisely the regime that matters for soft materials. A clear statement of which convention is used prevents a 50% disagreement at high strain from being mistaken for a material difference.
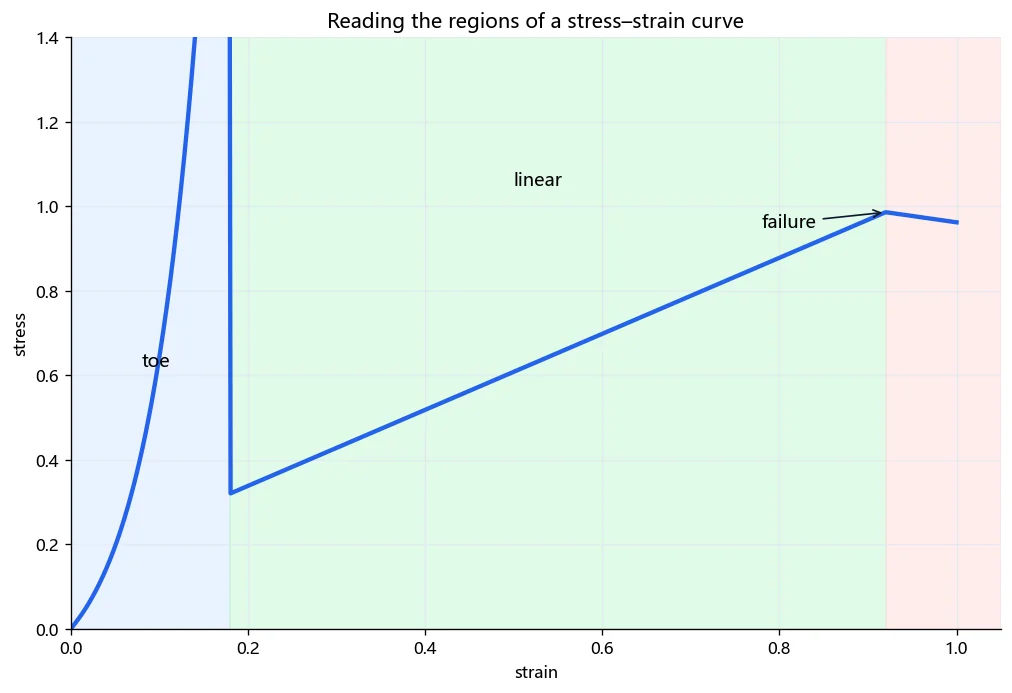
For anisotropic tissues, a single scalar modulus is rarely sufficient. The stress-strain response should be separated into regions: the toe region that reflects fiber straightening, the linear region whose slope is the conventional modulus, and the terminal region that marks yielding, softening, or failure. Reporting the toe strain, the linear-region slope, and the failure strain together is far more informative than reporting one slope fitted over an arbitrary interval. Whenever feasible, output the raw force-displacement trace alongside the reduced stress-strain data; the raw trace contains exactly the grip slip, cycle history, and failure location that the reduced curve hides.
To make the definitions concrete, consider a single silk fibroin fiber measured with a specimen gauge that is simple enough to verify by hand. Suppose the fiber has a diameter of 24 micrometers, giving a circular cross-sectional area of about 4.52 x 10^-10 square meters, and a gauge length of 10 millimeters. At an extension of 0.25 millimeters, the recorded force is 0.11 newtons. The engineering strain is then 0.25 divided by 10, or 2.5 percent, and the engineering stress is 0.11 newtons divided by 4.52 x 10^-10 square meters, which is about 243 megapascals. Dividing stress by strain gives a secant modulus of roughly 9.7 gigapascals, comfortably inside the range expected for degummed silkworm silk.
The same numbers begin to diverge once the extension becomes large, and this is where the choice of convention stops being cosmetic. At 20 percent strain, the true cross-sectional area of an incompressible fiber is about 83 percent of the initial area rather than 100 percent, so the true stress is roughly 20 percent higher than the engineering stress computed from the original area. For a fiber that stretches to 50 percent, the difference becomes substantial, and for many soft biological samples the difference is the entire reason that "ultimate stress" should always be reported together with the strain convention that defined it.
A worked toughness estimate follows the same logic as the area under the curve. If the stress rises linearly from 0 to 243 megapascals over a 2.5 percent strain, that triangular region contributes about 3.0 megajoules per cubic meter of energy per unit volume. Real silk is not a straight line, however; the toe region adds almost nothing at first, and the later stiffening region adds far more than a triangle would predict. Reporting one integrated toughness number is therefore only meaningful when the integration limits are stated, otherwise two groups can each calculate a defensible "area under the curve" and still disagree by a factor of several.
The stress-strain curve is not a single response but a history written in three or four overlapping processes, and part of reading it well is learning to separate them. The toe region reflects the progressive recruitment of fibers or chains that start in different configurations; the linear region reflects the collective stiffness of the engaged network; the yield or softening region reflects irreversible rearrangement, and the terminal region reflects failure, which may be localization in a film, fibril rupture in a fiber, or mesh breakage in a gel. A single number such as "modulus" necessarily compresses all of this history into one slope, so the slope must always be quoted with the strain interval over which it was computed, otherwise two groups reporting 2 GPa and 4 GPa for the same material may simply have measured two different parts of the same curve.
Cyclic loading extends this logic from one curve to a family of curves. Loading a specimen to 5 percent, unloading, loading to 10 percent, unloading, and so on exposes whether the linear-region slope is stable, whether the residual strain accumulates, and whether the hysteresis area grows with each cycle. For many biomaterials the second cycle is much softer than the first, and the third is close to the second; this is exactly the signature of a material that has "remembered" its preparation history in the first cycle and then behaves more reproducibly. Reporting only the first cycle therefore describes the handling history rather than the material, while reporting the third cycle describes a state that is more likely to be reproduced by another laboratory that preconditions in the same way.
For anisotropic materials, the meaning of "one modulus" disappears entirely. A tendon, an aligned electrospun mat, or a woven silk fabric has at least two principal directions, and the ratio between them is often more mechanistically informative than either value alone. Testing should therefore include specimens cut along and across the preferred axis, and the orientation must be defined relative to an unambiguous anatomical or fabrication reference. When only one orientation is possible, the report should say so explicitly, because a "modulus" without an orientation in an anisotropic material is closer to a single sample from a high-dimensional object than to a material constant.
Recognizing Artifacts Before They Enter a Paper
Many common measurement failures are easy to spot if the raw trace is inspected before curve fitting. A sudden load drop at the very beginning of the trace usually means grip slip or slack take-up, not material behavior. An offset between loading and unloading that persists after the first cycles indicates plastic flow, drying, or an improperly zeroed transducer. Hysteresis in a soft sample is expected, but the first-cycle area should be large and the later cycles should approach a repeatable loop; a loop that grows with every cycle is a sign of continuing damage or solvent loss.
Failure location is the cheapest diagnostic available. If a specimen consistently breaks within one millimeter of a grip, the recorded strength is a lower bound and the modulus may be contaminated by the same stress concentration that caused the break. Repositioning, changing grips, or reducing the gauge length can reveal how much of the reported value was an artifact. None of these checks require expensive new equipment, and all of them materially improve reproducibility.
Modern instruments produce a torrent of data, but a defensible measurement lives or dies in how that data is exported and stored. Force, displacement, and time should be kept as raw machine units together with the calibration factors that convert them into newtons and millimeters; converting too early makes it impossible to correct a wrong area or a wrong zero later. Each specimen deserves a short manifest that links its file to the cutting method, hydration history, mass before and after, gauge length, orientation, and the operator and date. A folder of curves with no manifest is a folder of anecdotes, because three months later nobody can reconstruct which curve was cut with which blade or dried for how long.
Units and significant figures are a quiet source of cross-laboratory divergence. Stress and modulus should be reported in unambiguous pascal multiples, with the energy density for toughness in joules per cubic meter, or at least with the precise unit written out the first time it appears. A modulus of "1.2e9" without a unit is wrong somewhere, and "1.3 ± 0.4 GPa" reported with too many trailing digits invites false precision. The appropriate number of significant figures is usually two or three, because the dominant uncertainty in soft-material testing is rarely the instrument resolution; it is the specimen-to-specimen variation and the systematic choices documented above.
Whenever possible, deposit the raw force-displacement files, the reduced curves, and the analysis script in a public or institutional repository alongside the paper. The script matters more than a spreadsheet because it encodes the exact definitions of stress, strain, and modulus interval that no methods paragraph can fully recover. A reviewer who can rerun the script from raw data does not need to trust that the figure was extracted correctly; a reviewer who can only see the figure has no choice but to trust, and scientific reproducibility is the slow replacement of trust with re-execution.
A Practical Reporting Checklist
A defensible mechanical test report should specify the specimen geometry and n, the hydration or environmental condition, the instrument range and calibration, the grip type, the strain rate and preconditioning protocol, and the convention used to compute stress and strain. The table below collects typical ranges for three classes of dry specimens; soft hydrated materials will generally lie below these values, but the table is useful for sanity checks.
| Material class | Typical modulus | Typical failure strain | Common caution |
|---|---|---|---|
| --- | --- | --- | --- |
| Silk fibroin fiber | 5-15 GPa | 10-30% | area from single-fiber diameter, not bundle |
| Electrospun PCL mat | 10-100 MPa | 50-300% | porosity and hydration dominate the apparent modulus |
| Mineralized composites | 2-20 GPa | 1-4% | grip stress concentration causes premature brittle failure |
The goal of this checklist is not to constrain creativity but to make cross-laboratory comparison possible. When a modulus is reported without specimen state, rate, and area definition, it is a local observation rather than a material property.
Uncertainty is part of the result
It is worth being explicit about the two families of uncertainty that mechanical data carry. Repeatability describes how close successive tests on the same specimen or on nominally identical specimens run in the same session are to one another; reproducibility describes how close results are when the operator, instrument, or laboratory changes. Both numbers belong in a report, and they are not interchangeable. A protocol with excellent repeatability and poor reproducibility is almost always hiding a systematic error that every run shares, such as a wrong area calculation or a fixture compliance that was never subtracted. A protocol with poor repeatability but average reproducibility is measuring a genuinely variable material. Reporting both forces the distinction into the open.
The most robust way to turn this into a number is a simple nested measurement design. Prepare several independent specimens from different regions or different batches, test each at least twice with a consistent preload and strain rate, and then separate specimen-to-specimen variance from within-specimen variance. The between-specimen term is the material or preparation variability; the within-specimen term is instrument and handling variability. Most reviewers will tolerate a larger between-specimen term because biological materials are heterogeneous, but a large within-specimen term is a red flag that the fixture or the data reduction is unstable. This decomposition takes minutes to compute once the data table exists and yet is absent from a surprising fraction of published biomechanics.
In the same spirit, the difference between what was planned and what was measured should be reported rather than rounded away. Specimens that were excluded, the reason for exclusion, and the final n that entered each panel are as much a part of the result as the modulus itself. Selective exclusion is one of the few moves that can make an honest protocol stop being honest, and the antidote is trivial: decide the exclusion criteria before unblinding the data and list every excluded specimen. Mechanical testing gains little from secrecy and everything from a complete trail.
References
- Fung, Y. C. Biomechanics: Mechanical Properties of Living Tissues. Springer, 1993.
- Lakes, R. Viscoelastic Materials. Cambridge University Press, 2009.
- ASTM D882, Standard Test Method for Tensile Properties of Thin Plastic Sheeting, ASTM International.
- Meyers, M. A., and Chen, P.-Y. Biological Materials Science: Biological Materials, Bioinspired Materials, and Biomaterials. Cambridge University Press, 2014.