Stress-Strain Curves: A Materials Science Primer
Contents / 目录
Why This Matters
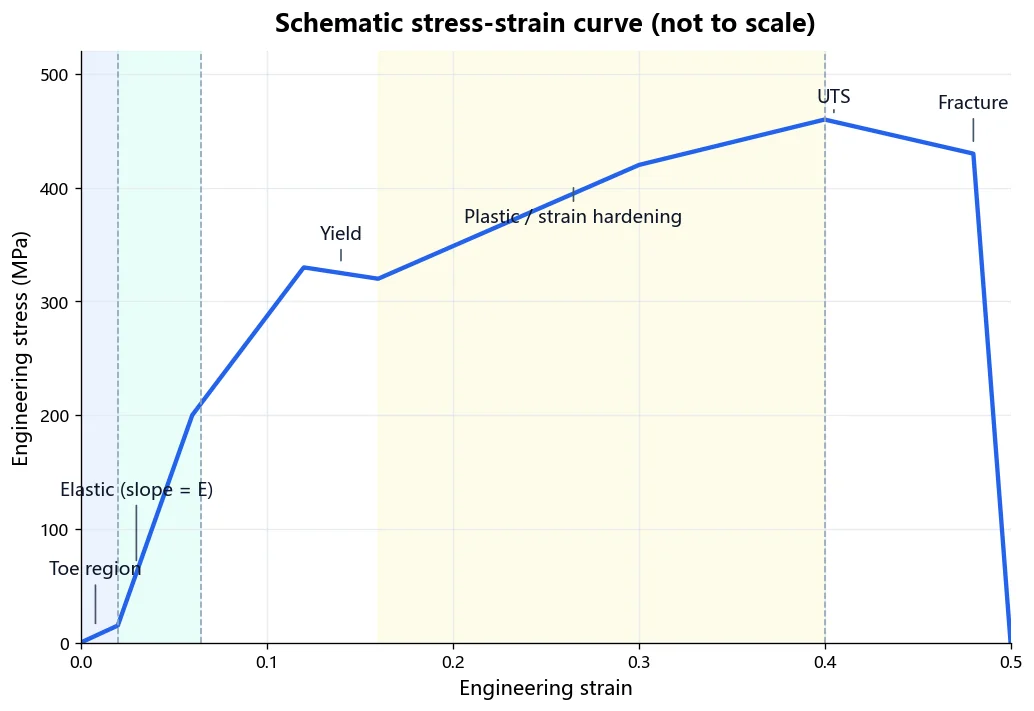
The stress-strain curve is the single most important graph in materials science. It tells you how a material responds to force: stiffness, stretch before breaking, energy absorption. Whether you work with silk fibers, hydrogels, or bone, understanding this curve is fundamental.
Stress (y-axis, Pa/MPa) = force / cross-sectional area. Strain (x-axis, dimensionless) = change in length / original length.
Stress = F / A0
Strain = (L - L0) / L0
Key Regions
| Region | What Happens | Key Parameter |
|---|---|---|
| -------- | ------------- | --------------- |
| Elastic | Reversible deformation | Young's Modulus E |
| Yield | Permanent deformation begins | Yield Strength |
| Plastic | Permanent deformation accumulates | Strain Hardening |
| Ultimate | Maximum stress capacity | Ultimate Tensile Strength (UTS) |
| Fracture | Material breaks | Elongation at Break |
| Material | Young's modulus (MPa) | UTS (MPa) | Elongation at break (%) |
|---|---|---|---|
| --- | --- | --- | --- |
| Mild steel | ~200,000 | ~400 | ~25 |
| Cortical bone | ~17,000 | ~120 | ~2 |
| Silk fibroin fiber | ~8,000 | ~500 | ~20 |
| Tendon (collagen) | ~1,200 | ~100 | ~10 |
| Rubber | ~1.5 | ~20 | ~500 |
Typical order-of-magnitude values; they vary with source, hydration, and strain rate.
Computing Mechanical Properties
import numpy as np

def compute_mechanical_properties(strain, stress):
    elastic_mask = strain < 0.02
    E, _ = np.polyfit(strain[elastic_mask], stress[elastic_mask], 1)
    UTS = np.max(stress)
    toughness = np.trapz(stress, strain)
    return {"E_MPa": E, "UTS_MPa": UTS, "Elongation_pct": strain[-1] * 100, "Toughness_MJ_m3": toughness}
Biomaterials Considerations
Soft biomaterials behave differently from metals:
- No sharp yield point — use 0.2% offset or secant modulus
- Strain-rate dependence — test at physiological rates, report the rate
- Hydration matters — test hydrated unless studying dried samples
- Nonlinear elasticity — J-shaped curves common (toe region + linear region)
- Hysteresis — loading/unloading differ; this is energy dissipation
def tangent_modulus(strain, stress, at_strain=0.05):
    idx = np.argmin(np.abs(strain - at_strain))
    w = max(5, idx // 10)
    return np.polyfit(strain[idx-w:idx+w], stress[idx-w:idx+w], 1)[0]
Common Mistakes
- Confusing engineering vs true stress (diverge at >10% strain)
- Not reporting sample dimensions
- Grip slippage appearing as extra strain
- Over-interpreting noise without smoothing
References
- Callister, W.D. (2018). Materials Science and Engineering: An Introduction. Wiley.
- Meyers, M.A. & Chawla, K.K. (2009). Mechanical Behavior of Materials. Cambridge.
- GitHub: MechAnalyzer — open-source stress-strain analysis tool.
- Dorfmann, A. & Ogden, R.W. (2004). A constitutive model for the Mullins effect. International Journal of Solids and Structures, 41, 1855-1878.
Advanced Topics in Stress-Strain Analysis
True stress and true strain differ from engineering values at large deformations. Engineering stress uses the original cross-sectional area, while true stress accounts for the instantaneous area reduction during deformation. For strains beyond 10%, the difference becomes significant. Most published data for soft biomaterials report engineering stress unless otherwise specified, so always check the methodology section when comparing literature values.
The strain rate sensitivity of biomaterials reflects their viscoelastic nature. At higher strain rates, the material appears stiffer because polymer chains have less time to relax and reorganize under load. For physiologically meaningful results, test soft tissues and hydrogels at strain rates matching their in vivo loading conditions: approximately 0.01 to 0.1 per second for most connective tissues.
Cyclic loading reveals the Mullins effect in many biomaterials: the stress required to reach a given strain decreases with repeated cycling. This stress softening stabilizes after several cycles and is attributed to the progressive rupture of weaker sacrificial bonds within the network. The stabilized cycle is typically reported as the preconditioned response.